Analytics & QA
Quality Assurance
Quality Assurance helps you assess the quality of the tasks and understand where errors occur. This lets you determine if the annotation quality meets your quality standards and understand how to iterate your setup for improved quality
Tasks for QA will be sampled from your project at random. You may choose any % of tasks in the sample for QA. Our users typically sample 10% of tasks, and we recommend a minimum of 30 QA tasks for statistical significance.
Performing QA
Steps:
-
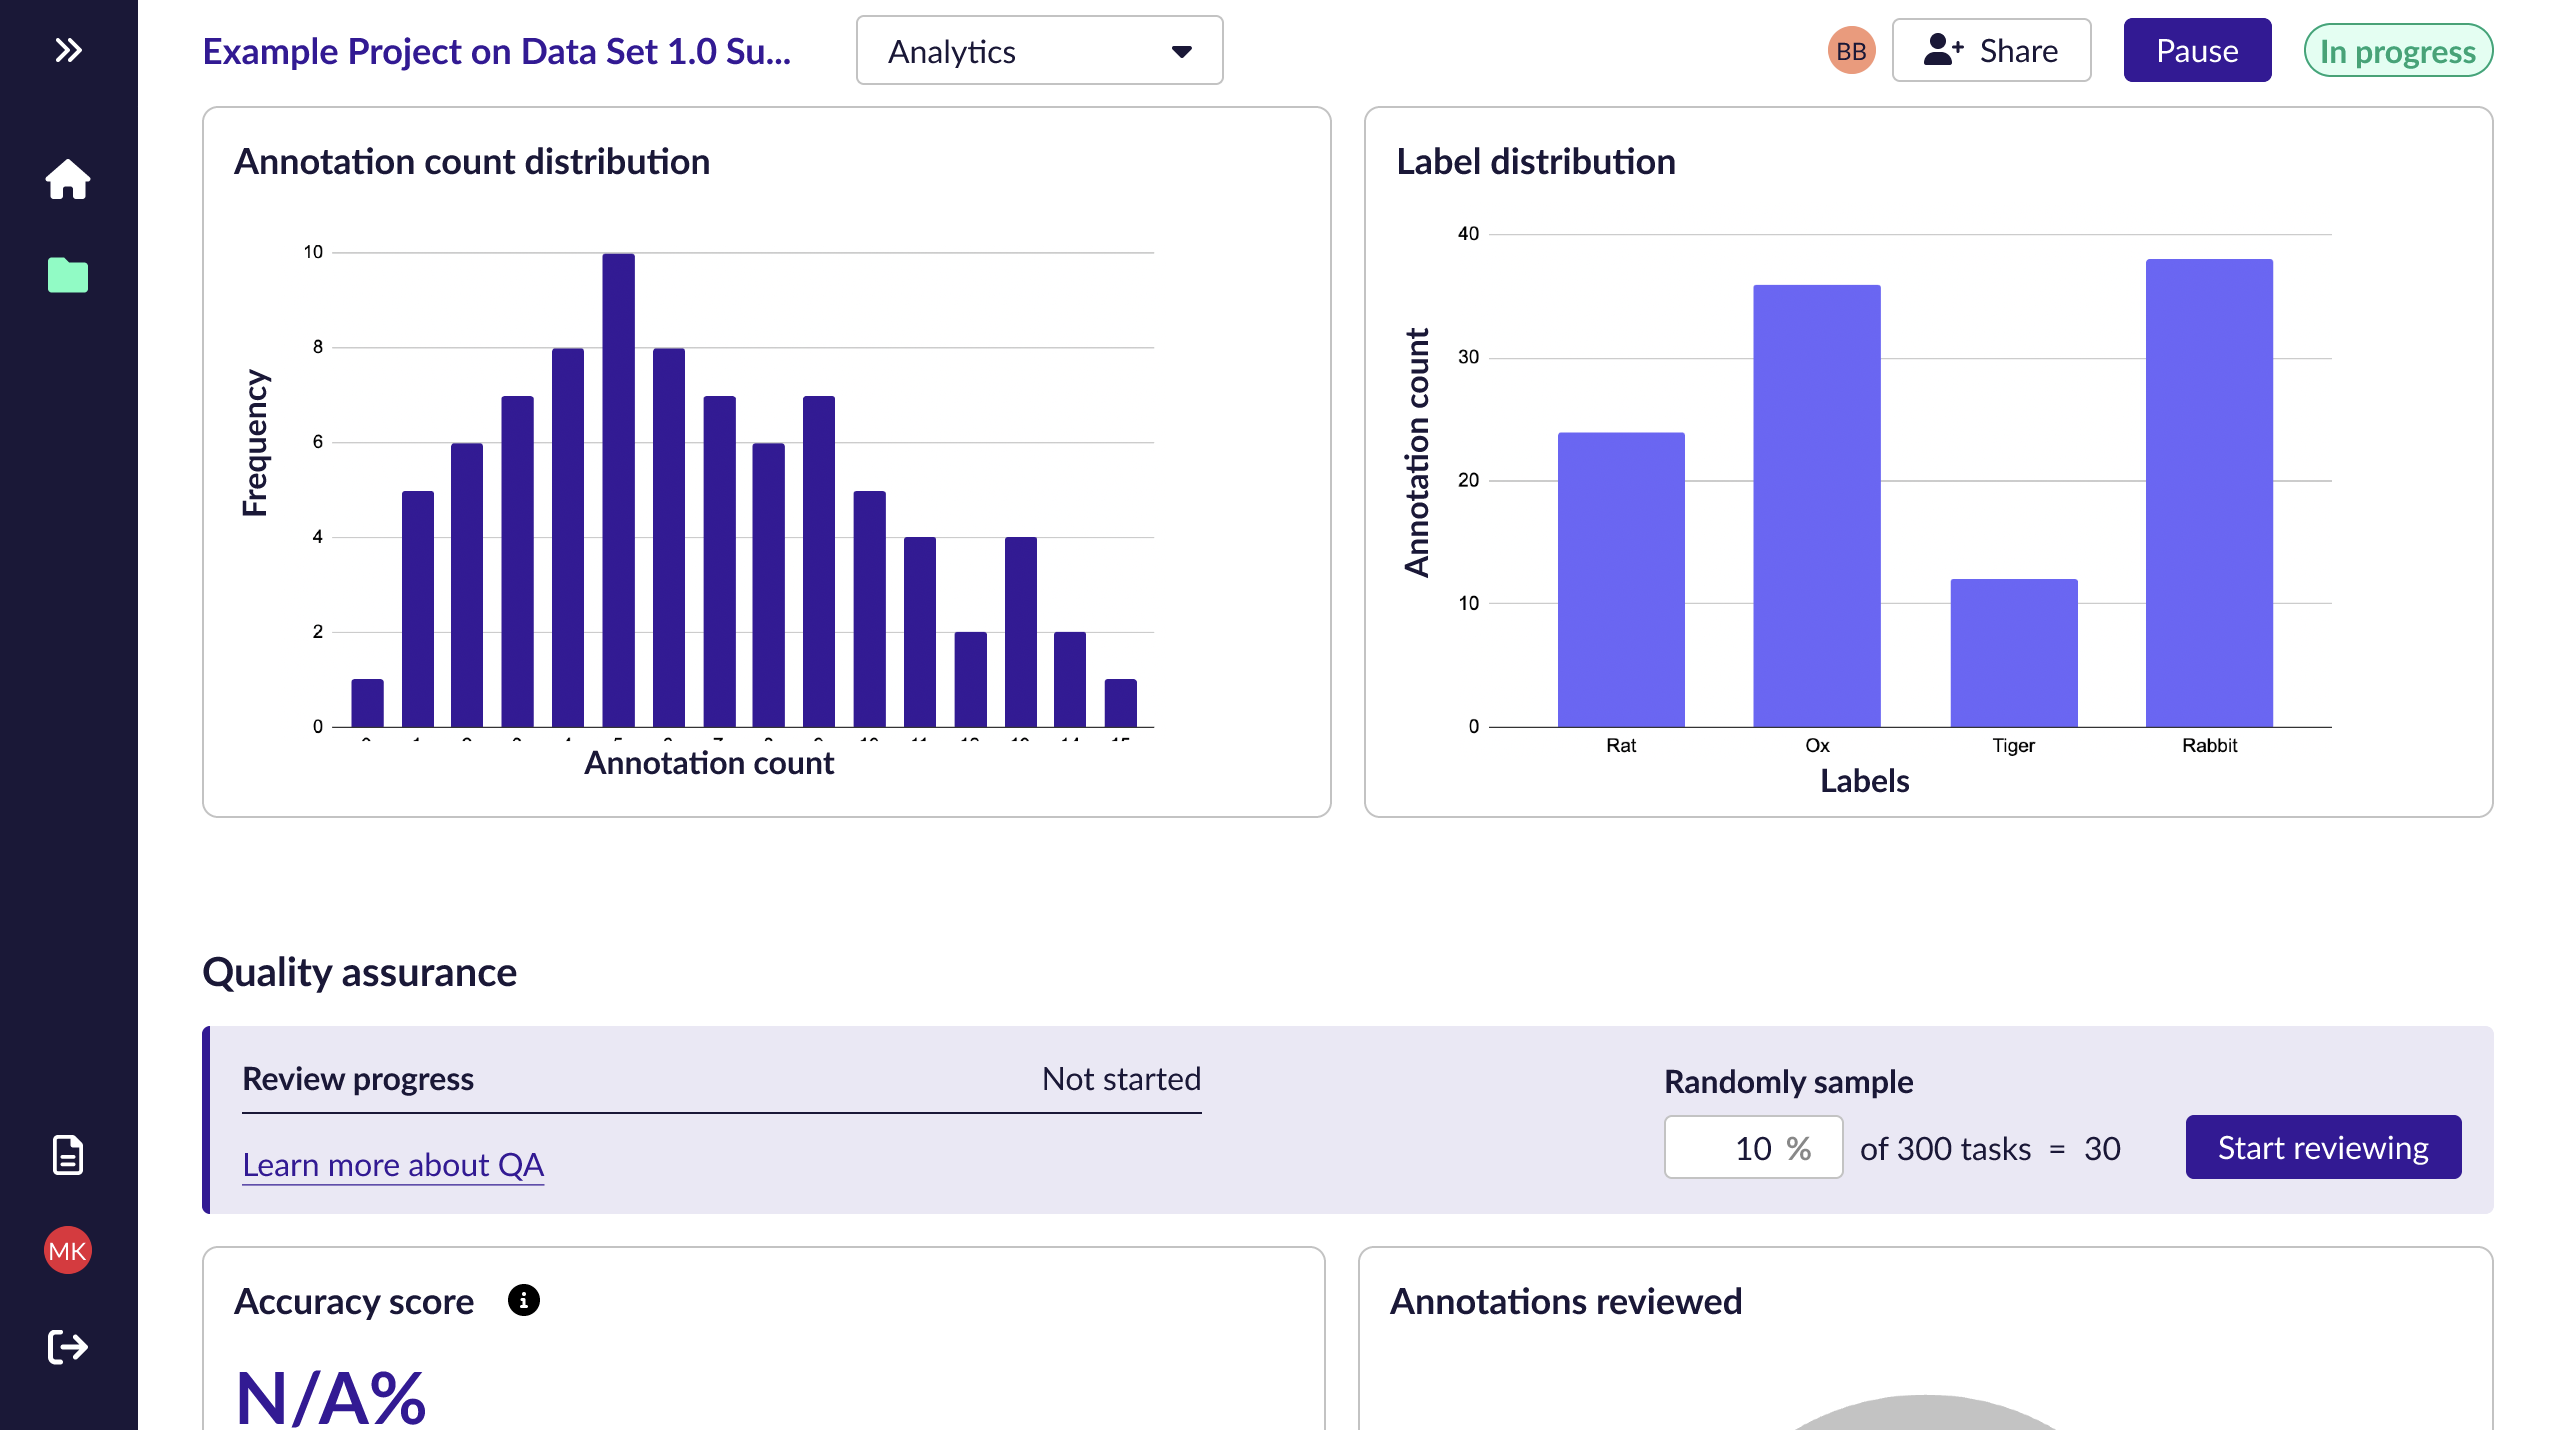
Click on Start reviewing under [Analytics]
-
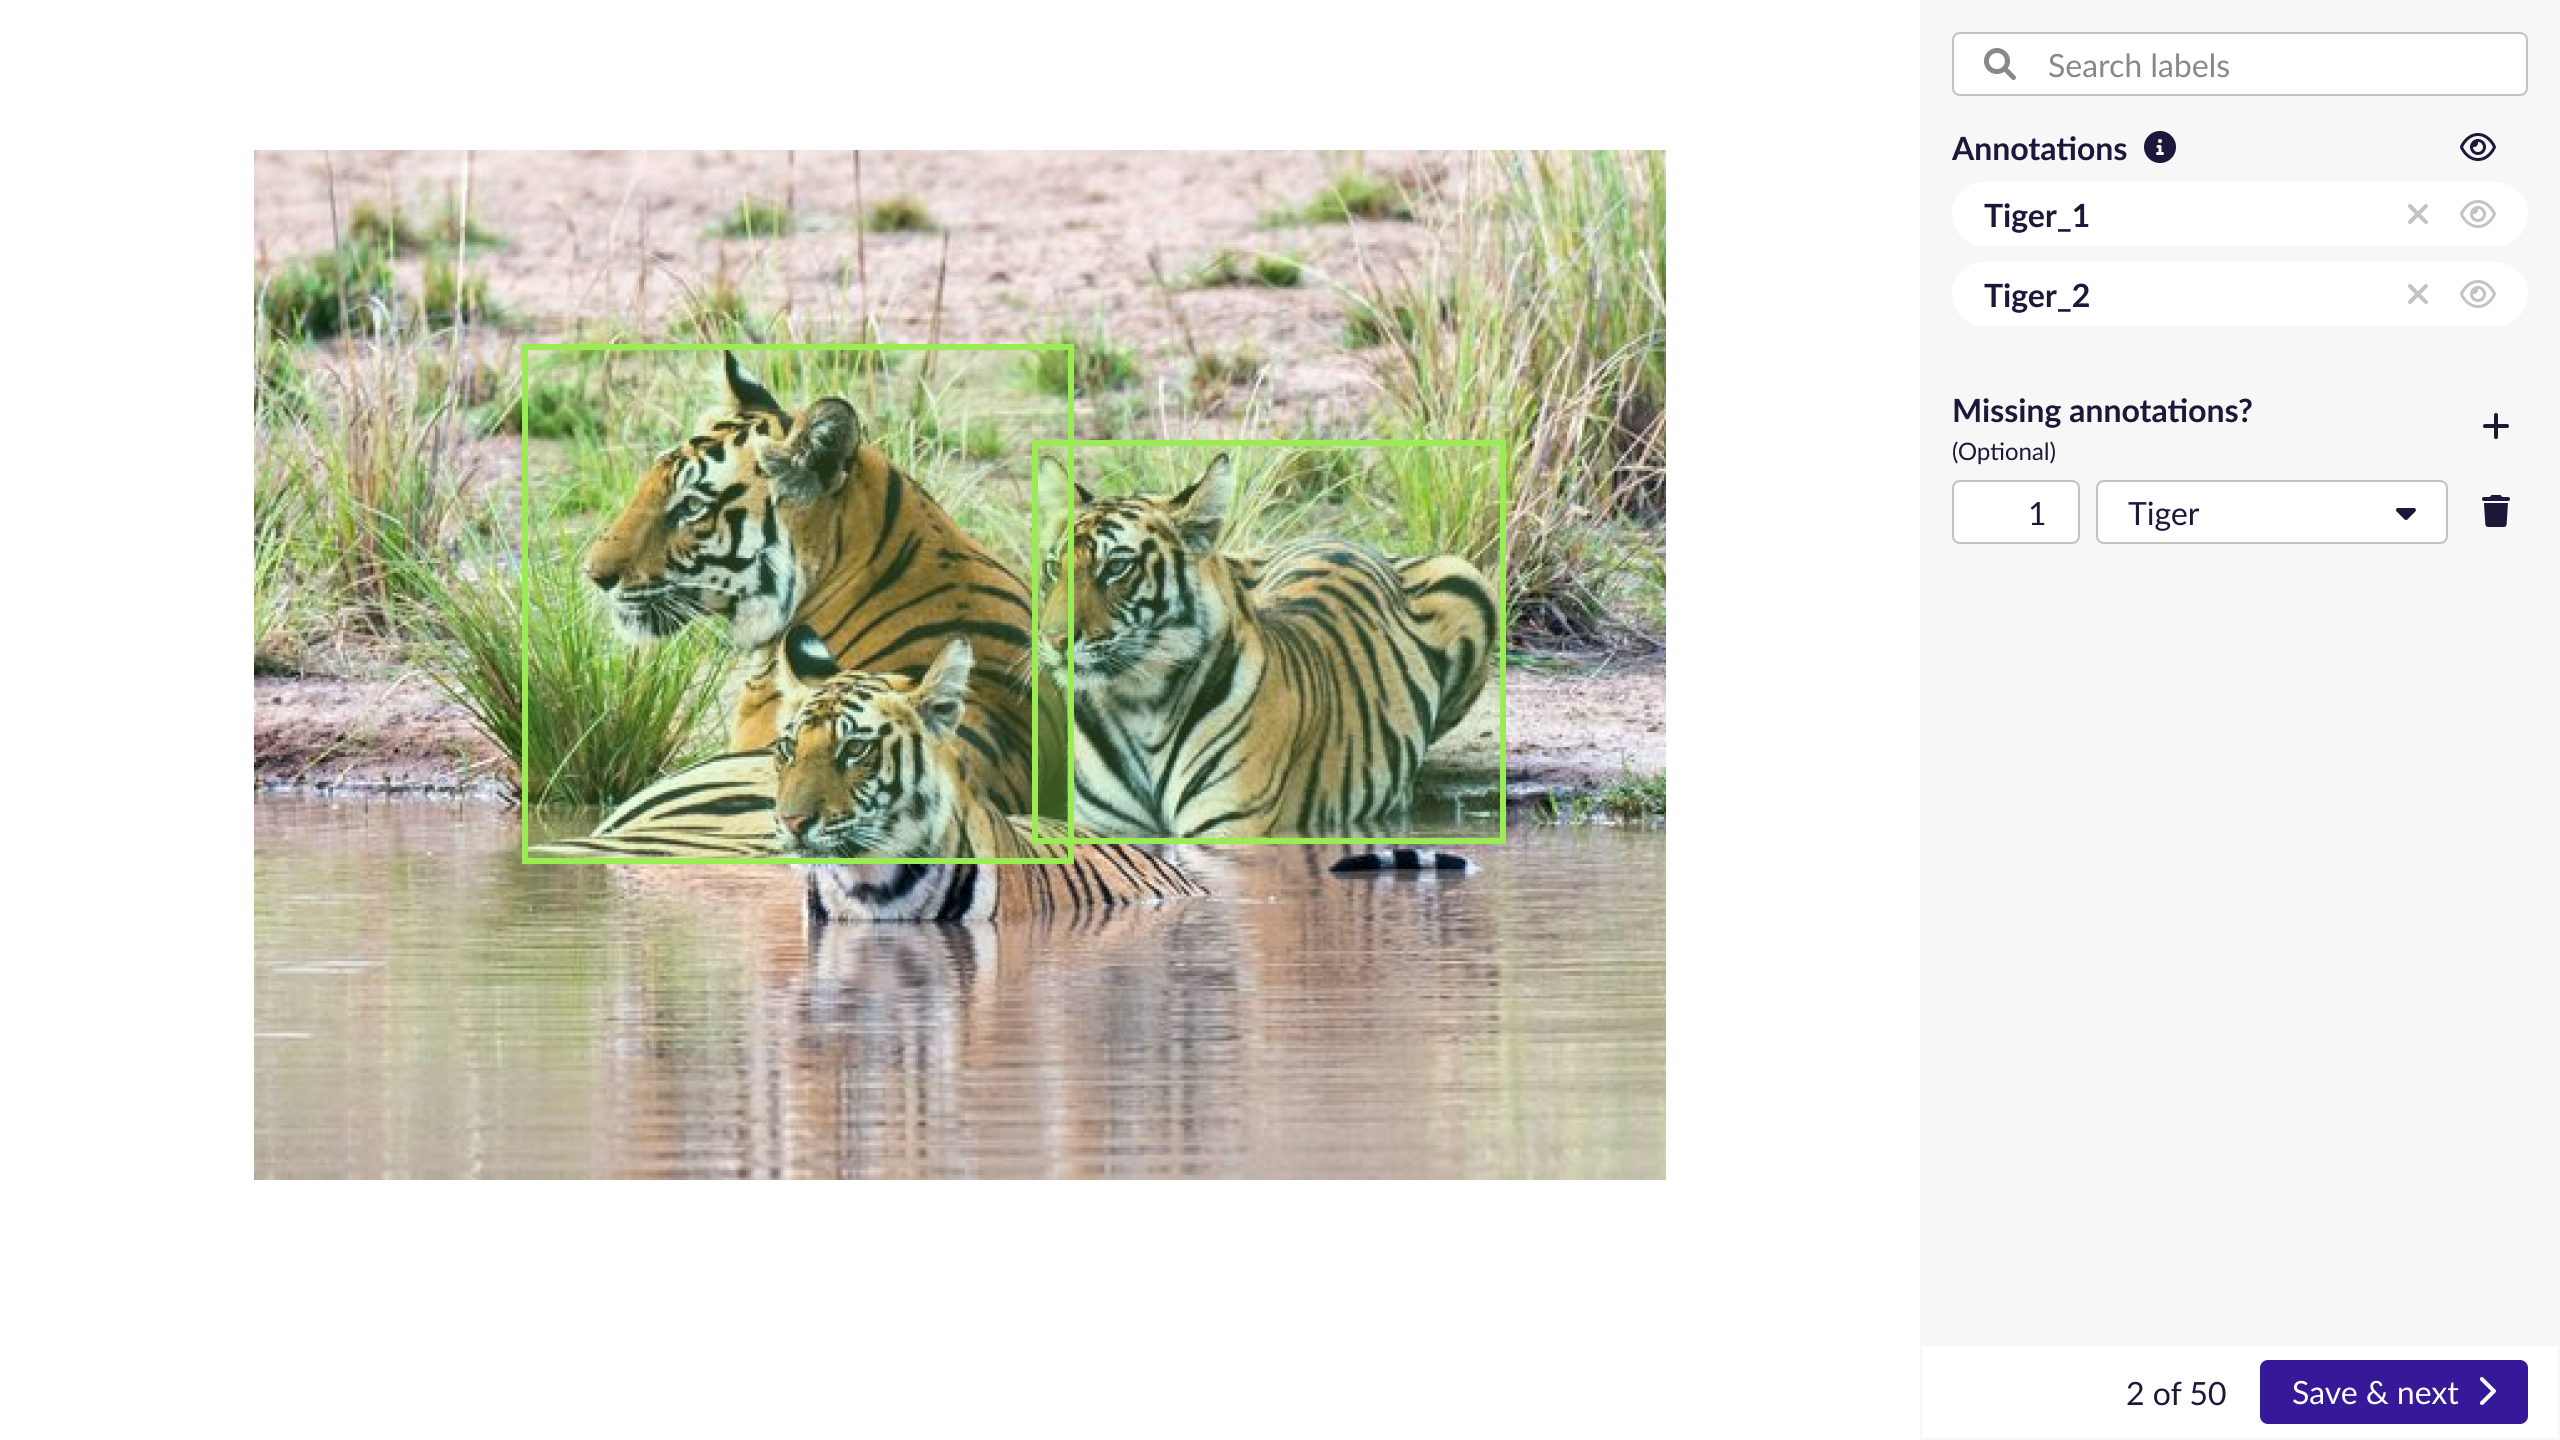
Reject incorrect annotations and provide a reason from the dropdown list: Mislabelled, Rejected, Unwanted annotations
-
Indicate missing annotations by inputting the count and selecting the label
-
Save & next
-
Repeat till all QA tasks are done
Note: Tasks that are not rejected are considered accepted
Quick glossary:
| When annotation is... | This means that.. |
|---|---|
| Mislabelled | It should be labelled something else. Specify what the correct label is. |
| Bad overlap | It has the correct label, but was drawn too loose or too tightly. |
| Unwanted annotations | It shouldn’t have been annotated at all. |
Understanding your QA insights
Once you have performed QA on some tasks, you will find an overall accuracy score of your project alongside a breakdown of the annotations evaluated. Keep in mind that this is just a summative representation of your tasks.
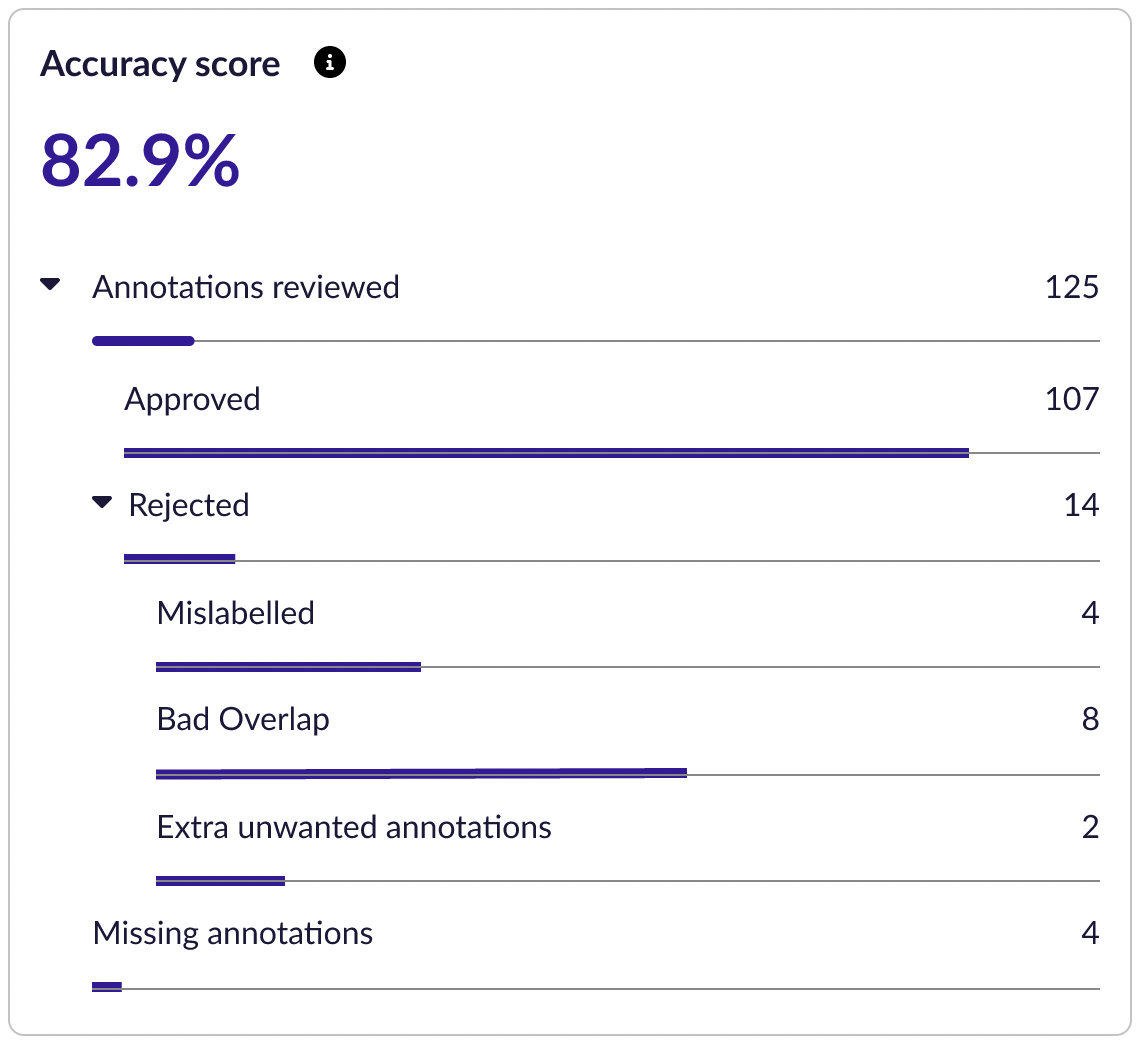
Accuracy = Approved/ (Annotations reviewed + Missing annotations)
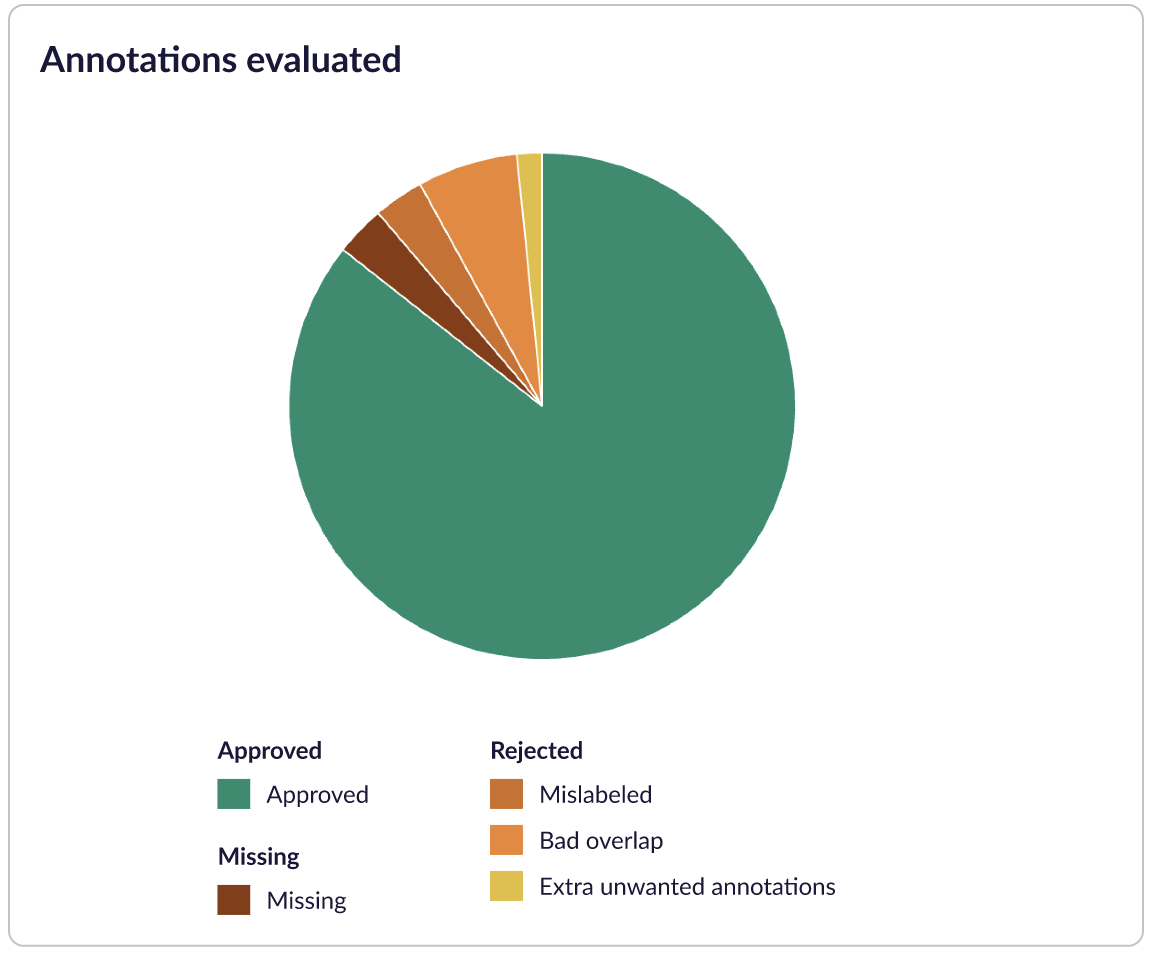
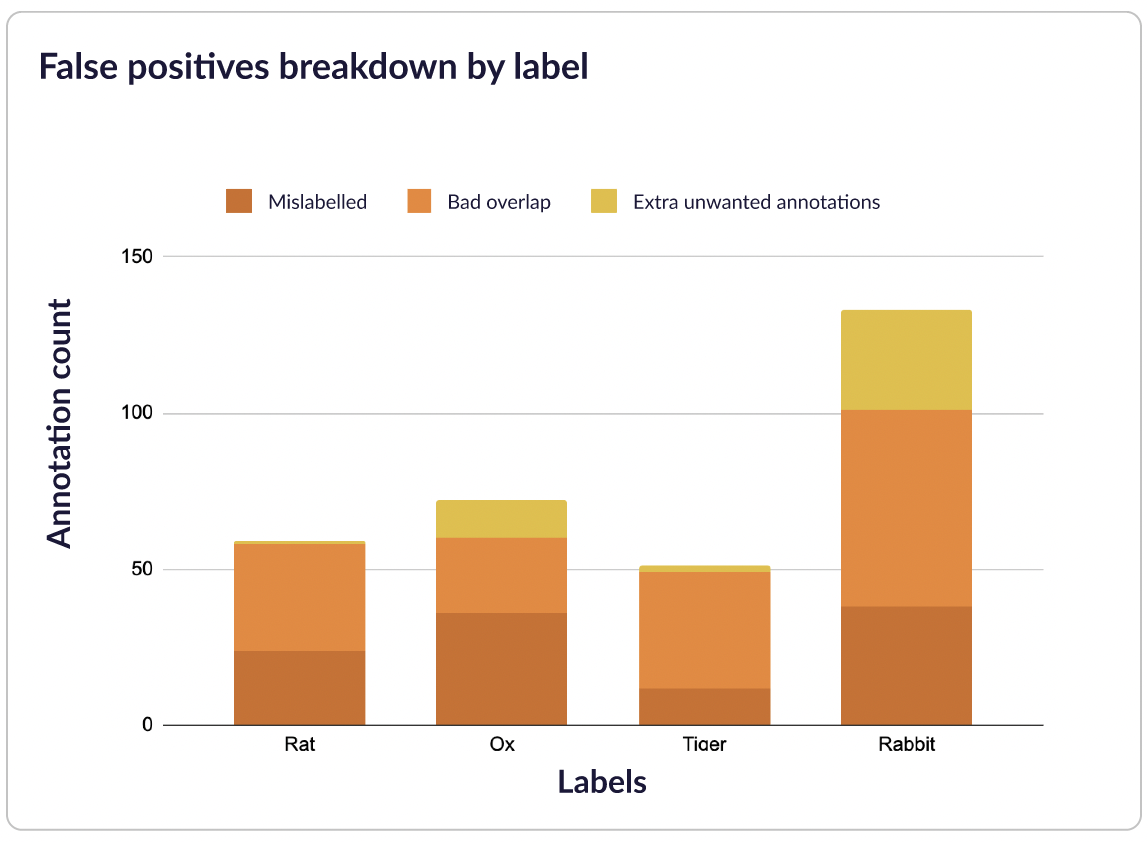
This pie chart is a quick breakdown of the annotations you have approved or rejected. You can hover each section to see the percentage being represented.
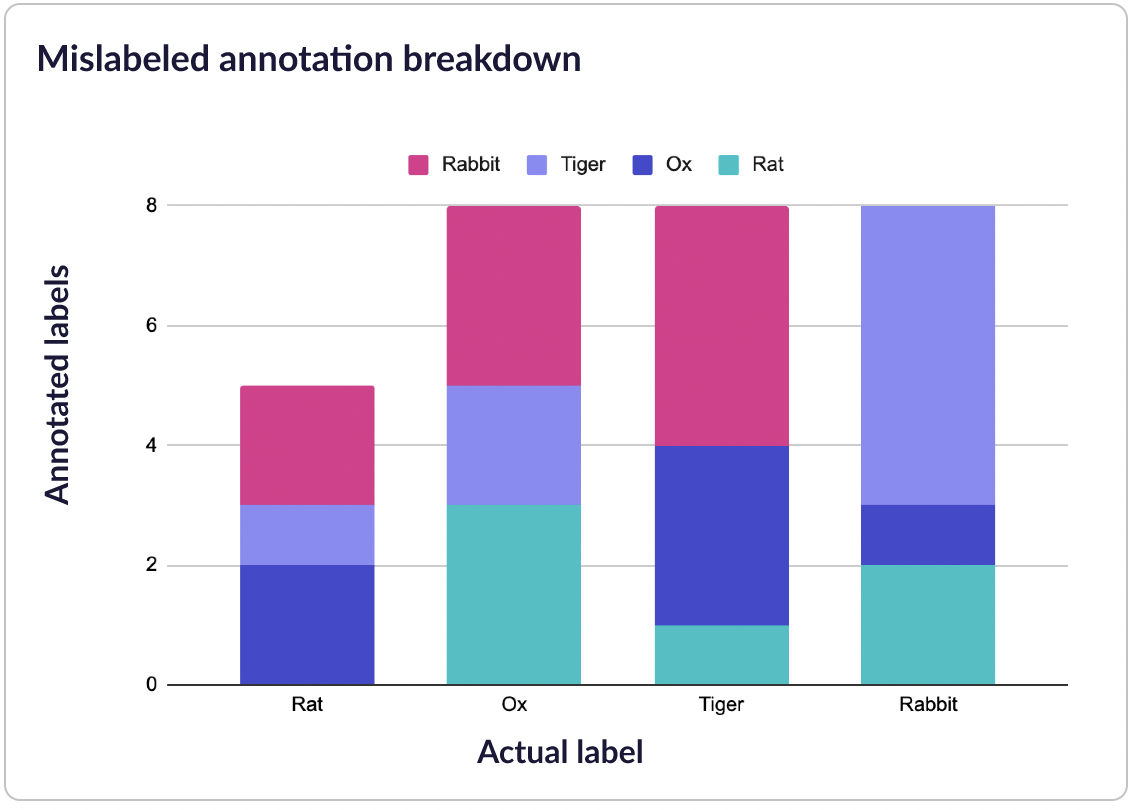
This stacked bar chart shows all labels which have been rejected. You can see which errors occur frequently with specific labels.
Labels which have been rejected will be shown in this stacked bar chart. You'll be able to see which errors occur frequently with specific labels.
s
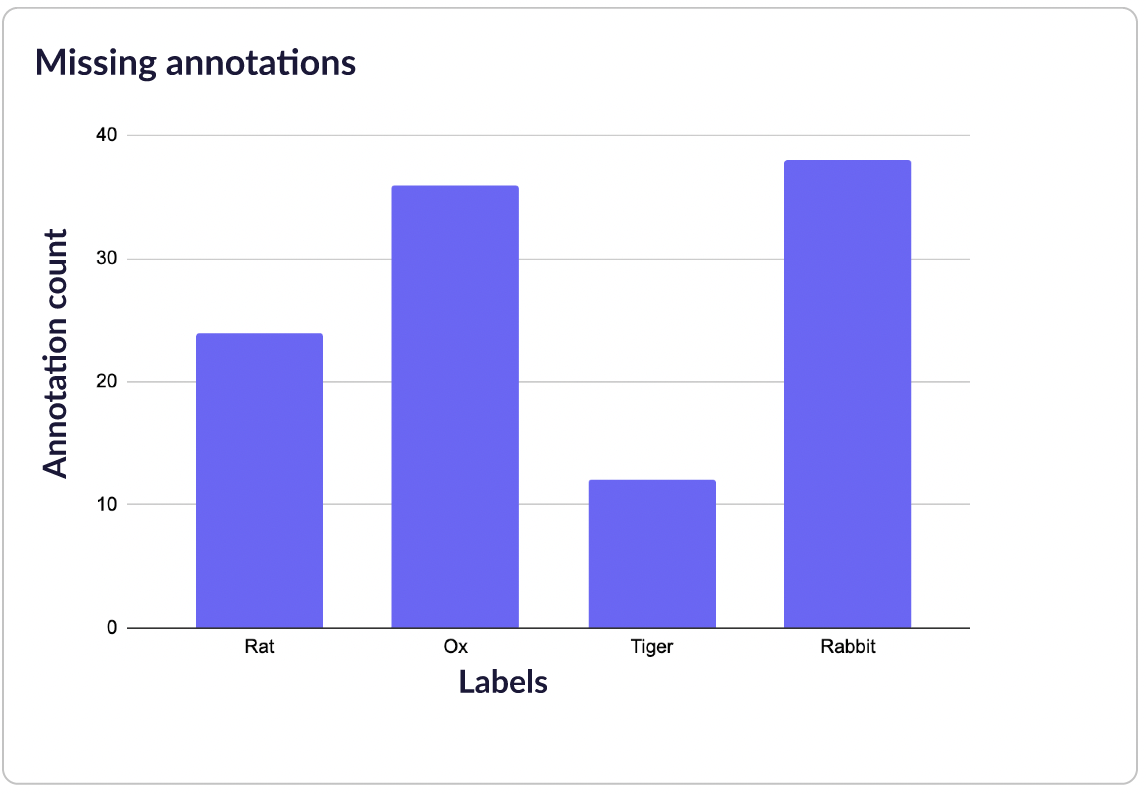
This chart shows that rabbit is commonly missed out. It may be helpful to clarify edge cases on when to annotate or not annotate them.
Updated over 1 year ago